|
|
Exam-Style Questions on Speed Time GraphProblems on Speed Time Graph adapted from questions set in previous Mathematics exams. |
1. | GCSE Higher |
Here is a speed-time graph for a drone.
(a) Work out an estimate for the distance the train travelled between the 10th and 15th second.
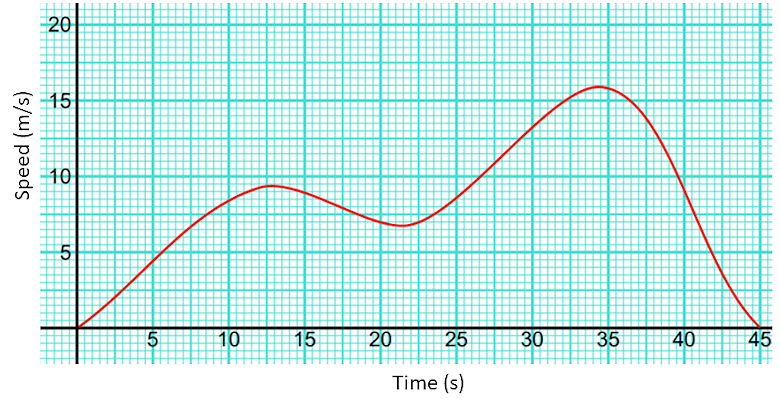
Is your answer to part (a) an underestimate or an overestimate of the actual distance the train travelled during that time? Give a reason for your answer.
Noah used the graph to find out an estimate for the deceleration of the drone at time 35 seconds. He realised that it took ten seconds for the drone's speed to fall to zero.
Here is Noah’s working.
(b) Noah’s method does not give a good estimate of the deceleration at time 35 seconds. Explain why.
If you would like space on the right of the question to write out the solution try this Thinning Feature. It will collapse the text into the left half of your screen but large diagrams will remain unchanged.
The exam-style questions appearing on this site are based on those set in previous examinations (or sample assessment papers for future examinations) by the major examination boards. The wording, diagrams and figures used in these questions have been changed from the originals so that students can have fresh, relevant problem solving practice even if they have previously worked through the related exam paper.
The solutions to the questions on this website are only available to those who have a Transum Subscription.
Exam-Style Questions Main Page
To search the entire Transum website use the search box in the grey area below.